Ruby Performance, a Visual Guide
This past weekend, I spoke at RubyNation about using some methodologies from other communities and applying them to Ruby performance monitoring and debugging (Slides here). I also tweeted this key image/slide, which has seemed to have struck a chord with Rubyists:
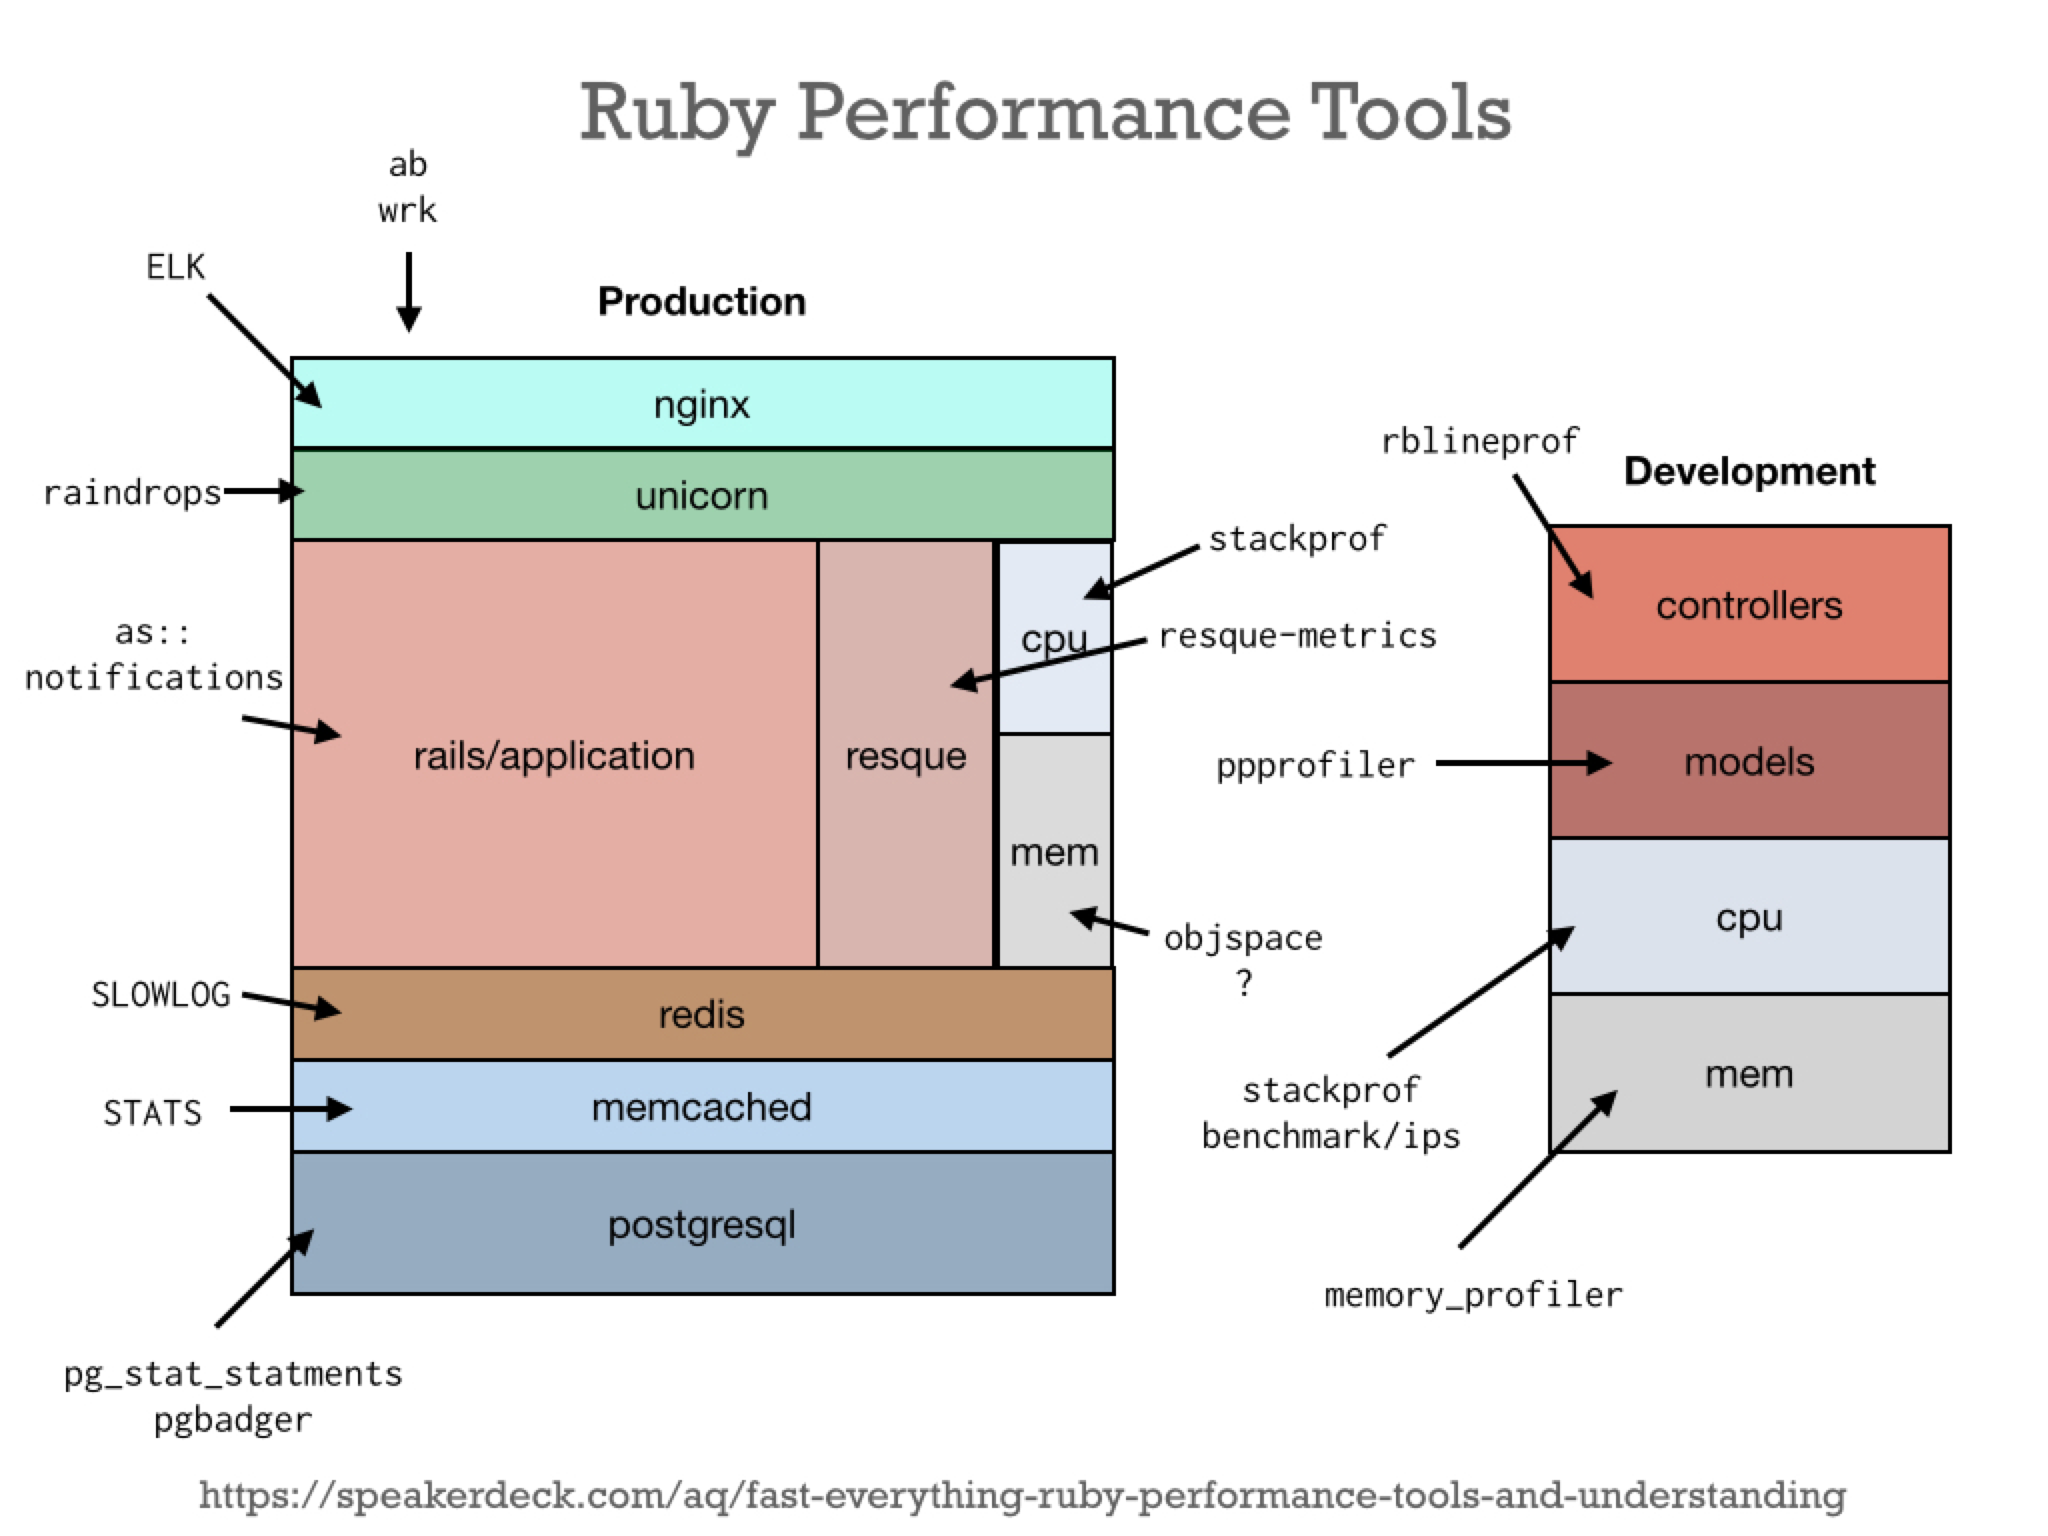
The slide was inspired by Brendan Gregg‘s essential work on Linux Performance. I’ve been worshiping obsessing over following Brendan’s work for a while now, and his System’s Performance Book is frequently quoted at work. The central theme of my talk was trying to apply the U.S.E. method to Ruby/Rails application performance. This idea ended up bearing more fruit then I could present in a short (25 min) talk, so the diagram above provides a overarching view of the work.
There are a few key takeaways here:
There are many tools, and that’s OK
It’s important to try to think about tools in the framework of the Unix philosophy of small programs that do their job well and are modular and compose-able. As application programmers, we’re often looking for the one true ring of performance monitoring and debugging, or worse, trying to use a tool we know, meant for a specific use-case, as general-purpose. So it’s great that there are a proliferation of tools, we just need to know what they’re good for and how to wield them.
It’s also worth noting that there are WAY more tools then I outlined in the talk/diagram such as schneems/derailed_benchmarks.
Development is a different world from production
This seems obvious from an infrastructure point of view, but is also true from a tools perspective. There are a ton of tools that provide little value against production because of the probe effect or non-useful data. Know which tools you can use in which environment.
Saturation is often overlooked
I was glad that @indirect brought this up in his talk, too (hopefully slides/video will be available soon) – we often spend a lot of time looking at Utilization (averages/response time) and Errors in our applications, but rarely look at Saturation (how much extra work our application has to do, but doesn’t have capacity to handle). There are some easy ways to measure this for certain stacks (nginx, unicorn) but if you’re stack doesn’t provide this easily, that should be a concern.
Ruby has some gaps, we should be aiming to fill them
Specifically, there really aren’t any good tools for debugging Ruby Memory usage in production applications. (I’ve heard rbkit has made some progress recently, though haven’t heard reports from the real world). There are finally some decent APIs in Ruby itself, I’m hoping all it takes is some smart people to steal some get inspired by the awesome tools in other mature languages.
If you or your team wants to learn more about these tools, I’m now available for training and consulting.
 Subscribe via RSS