How to Think About Web App Performance: Start With a Square
Even though I've spent a lot of time in the backend, I'm a pretty visual person and when I think through technical concepts I often try to imagine them in 3D. Something like The Matrix, but William Gibson style. Reducing some of these complex topics to something representational sacrifices some of the outlying details to make talking, reasoning, and teaching it easier.
I've been back working with some clients on optimizing the performance of their web applications and I've been revisiting this graphical way to explain how I think about this work. I first talked about this at RubyConf 2014:
Starting to treat your application as a square
I like to think about applications as they sit in "server-land" as squares first, with user requests traveling through the layers top to bottom. This isn't unusual - we usually talk about these different parts of our stack as "layers". On top of this, I add another aspect - each request by a client (user) to the backend application traces a vertical line and that vertical line maps to a single "path" through this application. In Ruby on Rails (or pretty much any http server), this path maps to an action. That action might map to a long call tree that calls other action-like items but for the most part that path is repeatable, even if it crosses many services and looks more like a desire path than a paved one. The purpose is to collect and trace these common paths as grouped actions1.
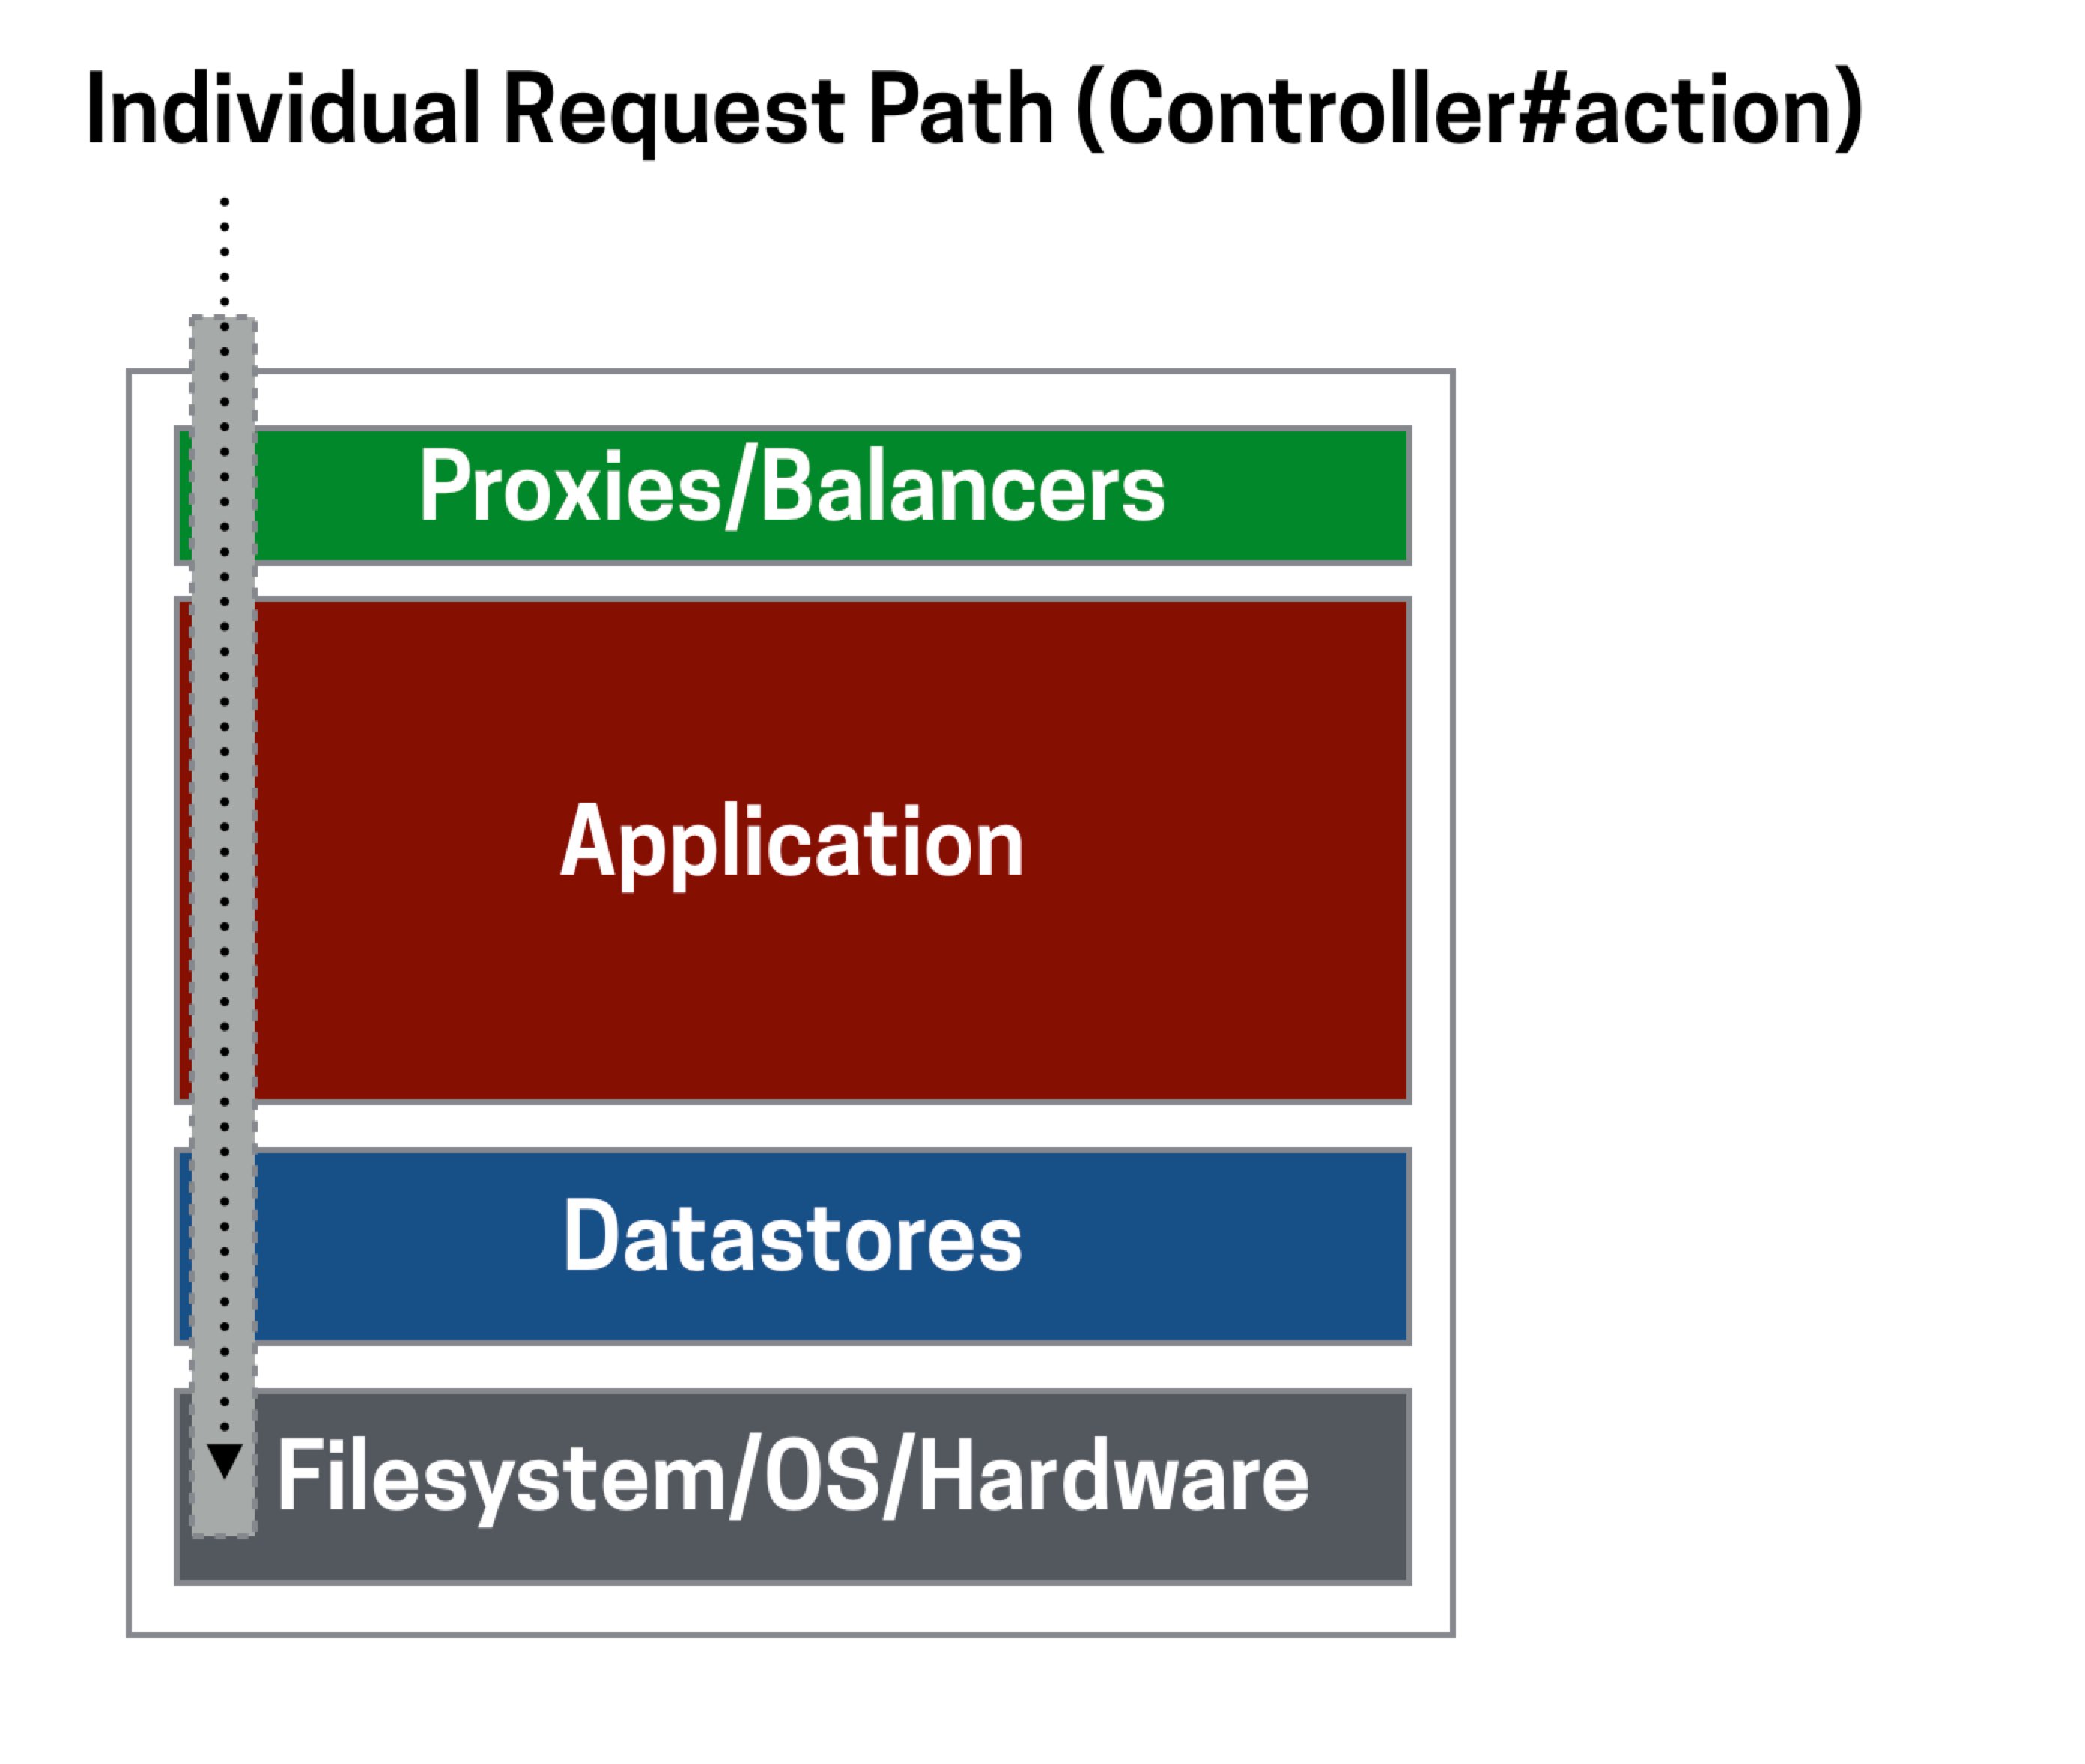
When I think about requests and layers this way, we can talk about the different type of work we do to optimize performance as vertical or horizontal. Vertical performance work optimizes paths by looking at key requests and trying to fix their problems. Horizontal performance work addresses full layer or services by improving, replacing, or upgrading the functional processes.
Vertical Performance: Optimizing Requests
With the proper monitoring (through logging or a third-party service), we should be able to get a good overview of the different paths that users are traveling through our application. In an ideal set up, we should get a clear sense of the most problematic actions. These aren't always the ones with the highest response time, rather theres usually a simple function to be applied which looks something like:
95th Percentile Response Time
x # of requests
--------------------------------
 Made up number to sort by
If we sort that number by highest first, we get a decent sense of our "hitlist" - the requests that take up the most time in our backend that we should attack first.
When we peer into one of these vertical slices what we actually want to see first is a collection of user requests to this path and the timings across the different layers as percentiles. This gives us a good sense of what part of our stack these requests are spending time in (DB? Cache? Just code? External services?).
With these relative scales, the work becomes pounding on this slice until its vertically smaller and takes less time. I'll leave the details of this for another post, but the general idea is to create a harness to test the slowest version of this request in our development environment. From there we can use all the tools at our disposal to try to track down the individual problem aspects of this path and make them faster. Often this is removing parts of requests by deferring them into the background, putting them behind a cache, or just straight deleting code.
A job well done here will show an improvement across the site-wide response time. Thats not always the case, but an improvement of even just a few milliseconds to a path that is the #1 request by an order of magnitude can make an outsized difference.
One of my clients had a post-page load POST request that recorded metrics about the page for user-facing analytics. This request happened on almost every page and was easily the #1 request (in terms of numbers of requests). For simplicity sake lets say it was called 10K times an hour. Its 95th percentile response time was relatively fast compared to the rest of the application, 100ms. The "user dashboard" page for comparison was requested about 1K per hour and had a 95th response time of 500ms. Doing the simple math, the hitlist time for the dashboard is 500,000 (500 * 1000), while the metrics request was 1,000,000 (100 * 10000). Reducing the response time of the metrics request even by 10% creates a significant reduction in the overall time our server spends handling requests. In this case we realized there were some easy but impactful things to do. We actually didn't need to record metrics for every request (reducing the hourly count). We also pushed some of the calculations the action was doing into the background, cutting the response time in half.
Horizontal Performance: Optimizing Infrastructure
Horizontal work focuses on entire layers instead of individual requests. The work here is often infrastructure tasks instead of code. Different layers have different optimizations, but they mostly fall into similar categories. Upgrades to the processing power (hardware) can sometimes be the thing that solves the biggest performance problems. This often comes down to questions of money - bigger boxes require more dollars. If you can have some open conversations with your team (or yourself if it's a team of one) about the tradeoffs of spending time on piecemeal performance work vs buying new hardware, then occasionally you can just throw money at the problem and be done with it (for now at least).
This isn't always the case. Sometimes its not about the size of the box but its configuration, or even the way the layer is being used. An easy example would be a relational database with a poorly designed schema or missing indexes. The work here isn't fixing an individual request, but improving the performance of this layer horizontally across the square.
I've come across this a number of times: the database or caching layer was poorly configured and was queuing trying to handle too many simultaneous connections. Implementing connection pooling across the board improves the overall throughput and you see a noticeable drop in your overall metrics.
You don't have to only choose one
The goal here is not to pick a single angle and only focus on that, its to identify two distinct ways to think about web application performance. With the awareness of these different angles we can pick and choose which are the most pressing to work on and create rubrics for identifying the highest value work.
I'm interested to hear how other people think about and describe these different types of work. How do you approach the performance work in your app? Do you take specific repeated steps? Do you divide these different areas between different teams?
-
Most SaaS monitoring tools work this way (i.e. NewRelic, Skylight). Even most logs can be organized this way, its up to you to use a tool to collect, process, and sort them.↩
 Subscribe via RSS